People love setting goals.
A quick scroll through Pinterest reveals thousands of beautifully designed vision boards and goal lists—many of them never acted upon.
Why? Because setting goals is the easy part. It feels productive, it’s exciting, and it gives us a sense of direction. But following through? That’s where things often fall apart.
We start with good intentions, but somewhere along the way, our goals fade into the background—forgotten, neglected, or simply abandoned. So what’s the missing piece?
In my experience, the most overlooked component of goal achievement is tracking progress consistently. Without a clear system to measure how far we’ve come—and how far we still have to go—it’s easy to lose momentum.
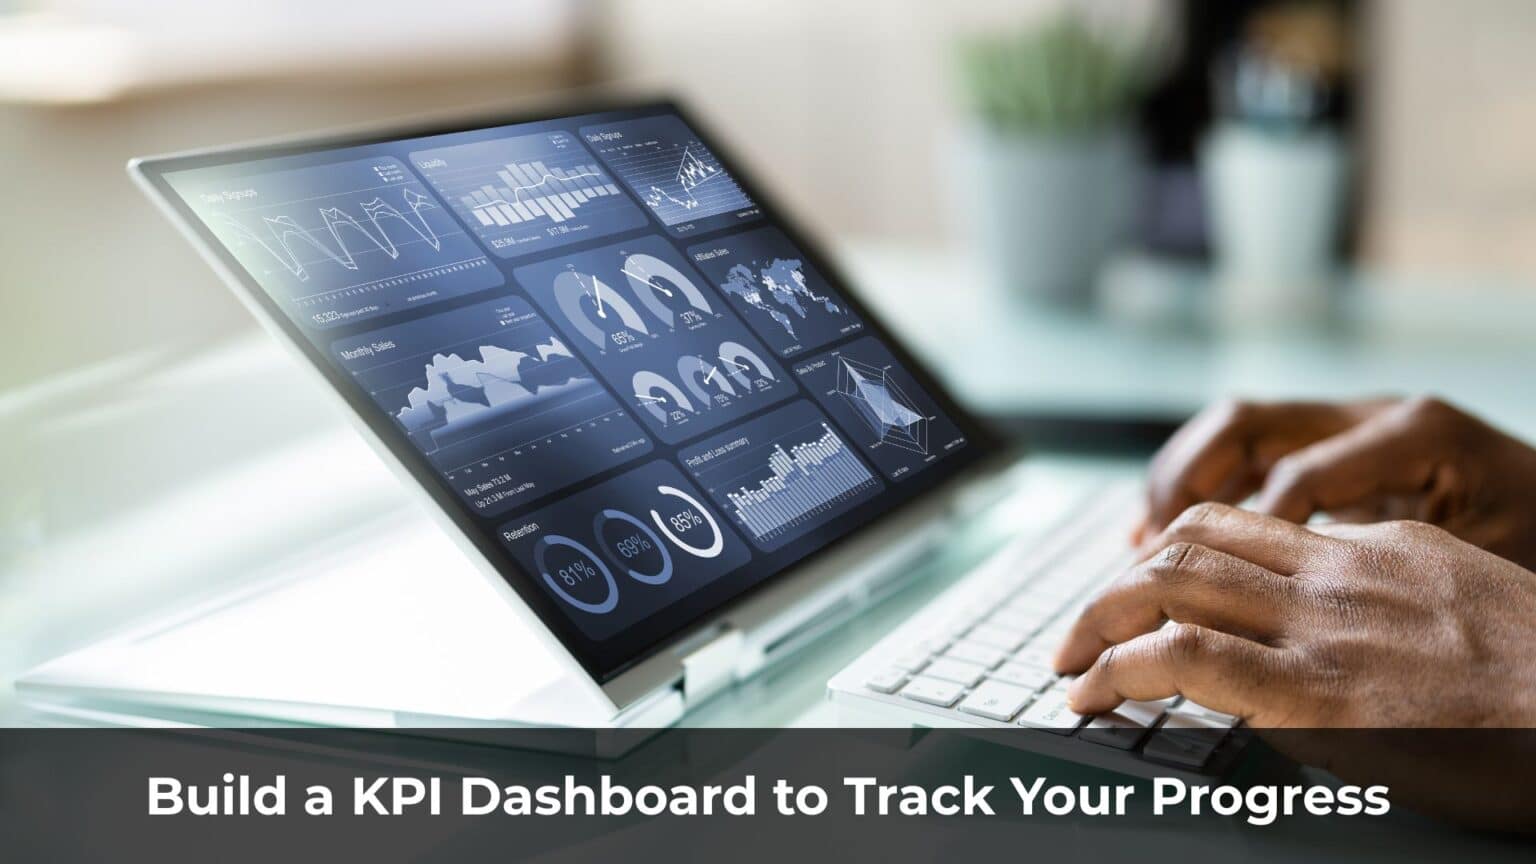
That’s why building your own KPI dashboard isn’t just a productivity hack; it’s a powerful tool for personal accountability and long-term success.
Table of Contents
ToggleCreating a System to Measure Progress
I have a theory: one of the brain’s primary jobs is to manage and allocate energy. And to do that efficiently, the brain needs clarity—it wants to know which activities are worth the effort.
That’s why, when you provide your brain with evidence that you’re making progress toward a goal, you activate a powerful feedback loop of motivation.
Take my personal journey with fitness, for example. There were many times in my life when I set out to build muscle. Every time, I made it a point to track my weight and take weekly progress photos. Why? Because those visible signs of improvement served as proof that my efforts were working.
Each time I saw progress, my brain responded with renewed motivation:
“This is working. Let’s keep going.”
Now, let’s zoom out and look at how companies and organizations approach progress.
Every successful company tracks performance using KPIs—Key Performance Indicators. These are metrics designed to measure how well the business is moving toward its objectives.
For instance, if the goal is to improve customer experience, a company might monitor return rates, email response times, and Net Promoter Score (NPS).
If the focus is on marketing, they’ll look at email list growth, social media engagement, or conversion rates.
The same logic applies to individuals. If you want to make real progress in any area of your life, you need to start measuring what matters.
For Businesses, KPIs Are Like a GPS—Why Not Use Them for Your Life?
A few years ago, I had a realization: in many ways, we are all the CEOs of our own lives.
And if that’s true, why not run our lives the way successful CEOs run their businesses? Why not apply the same strategies they use to track performance and drive results?
With that mindset shift, I began building a personal KPI dashboard—a simple, effective way to measure and manage my own growth.
I didn’t need anything fancy. Just a basic spreadsheet. But that spreadsheet became my personal GPS. It reminded me of my annual and monthly goals. It kept me focused on the daily habits that mattered most. It gave me clarity—and more importantly, accountability.
In the next section, I’ll walk you through the key metrics I track—indicators that have made a real difference in helping me stay aligned, motivated, and on track.
What Metrics Should You Track Consistently?
Everyone has different goals—so naturally, the metrics we track will vary from person to person.
Start by writing down your goal. Then reverse-engineer it: what daily or weekly actions actually move the needle?
If I wanted to become a stand-up comedian, I’d track how often I write new jokes and how frequently I perform on stage.
If your goal is to lose weight, you might monitor how often you go to the gym, your daily step count, or your average caloric intake.
Trying to get out of debt? Track your daily spending or how much you’ve saved each week.
As for me, my main goal right now is career growth—I want to reach a higher level of performance and impact.
To get there, I’ve identified two foundational pillars I need to optimize: physical health and mental clarity.
I want my mind to be calm, focused, and sharp. I want my body to have the energy to match my ambitions. That means tracking the habits that support both.
Here are the key metrics I currently monitor:
Deep Work Sessions: Tracked using Pomodoros. I log how many focused work sessions I complete each day.
Physical Health:
- Stretching
- Gym attendance
- Drinking 64 oz of water daily
- Sleep duration (measured with Oura Ring)
- Sleep quality (also via Oura Ring)
Mental Fitness:
- Listening to podcasts
- Meditation
- Screen time on my iPhone
But even the habits themselves aren’t fixed—they evolve over time.
A few years ago, I committed to reading at least 30 minutes every day. It felt like the best way to learn. But after powering through hundreds of business books, I started to notice a pattern: much of the content was repetitive.
Eventually, I realized that podcasts suited me better at that point in my life. They were more flexible, more current, and often more insightful. So I swapped the reading habit for a podcast habit.
And if one day I discover an even more effective way to learn, I won’t hesitate to shift again. That’s the beauty of self-optimization—it’s an ongoing process.
Of course, to track all of this effectively, you need a clear, well-organized dashboard. Numbers don’t lie—and when you can see your progress in black and white, it becomes much easier to stay on course.
Creating a Personal KPI Dashboard to Track Your Progress
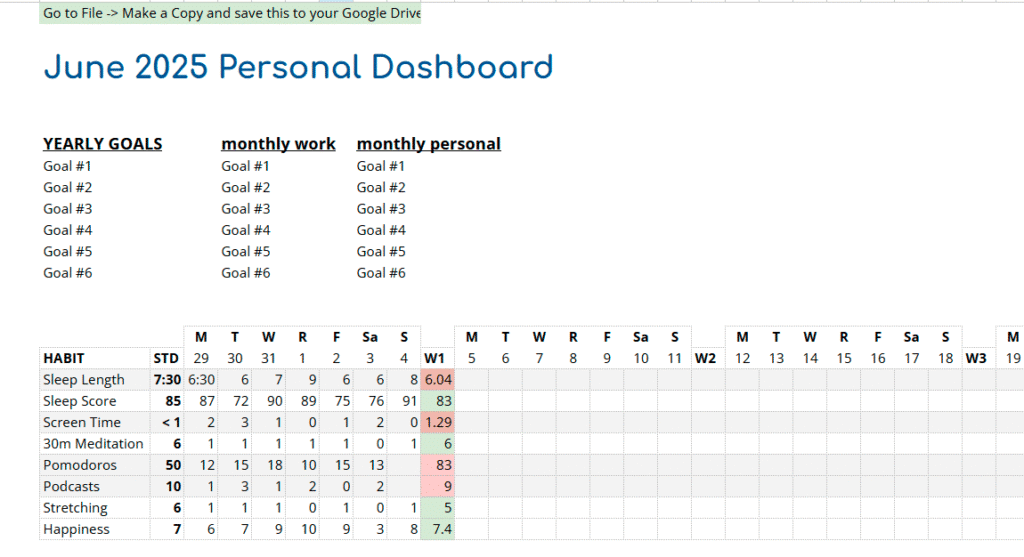
Here’s an example of a KPI dashboard I built to give you a clearer picture of how this works in practice:
As you can see, I track a wide range of metrics—everything from work performance to sleep quality.
But let me be clear: I don’t recommend starting out this way.
Most people are new to this kind of system. You probably haven’t built a habit of tracking personal data yet, and without that foundation, it’s easy to feel overwhelmed.
It’s like going to the gym for the first time—you wouldn’t follow a professional bodybuilder’s routine on day one, right?
Start small. Track just three meaningful metrics to begin with. That’s more than enough.
If you try to do too much too soon, you’ll burn out. The pressure will build, and by the end of the first week, you might be tempted to quit.
Remember: Consistency beats intensity. Repeating small actions daily is the most effective way to build lasting habits.
Now, you might be wondering why I use a basic Google Spreadsheet when there are so many fancy apps and tools out there.
The answer is simple: I value simplicity and flexibility.
Spreadsheets are easy to customize, quick to update, and completely under your control. No logins, no distractions—just you and your data.
I’ve shared my personal KPI dashboard template [here].
Make sure to make a copy and customize it for your own goals and habits.
How to Use This Spreadsheet Consistently
When it comes to tracking personal metrics, the hardest part is consistency.
The first challenge? Simply remembering to do it. Most people start with good intentions—but life gets busy, and habits fade.
To make it stick, I use a two-part system:
First, I keep a printed version of the spreadsheet beside my bed. Every night, before going to sleep, I fill it out by hand.
There’s something powerful about writing things down physically. It gives you a stronger sense of discipline—and a small feeling of accomplishment that digital tools sometimes lack.
Then, every Saturday, I transfer the data into a digital Google Spreadsheet. This allows me to calculate my weekly averages and visualize trends using simple color-coding. It’s quick, and it gives me a clear picture of how I’m doing over time.
Another common challenge is this: sometimes you won’t make as much progress as you hoped.
Years ago, this really frustrated me. I’d have one “perfect” week, followed by a completely off week—and it drove me crazy. I’ve always had a perfectionist streak, so the inconsistency felt like failure.
Have you ever felt the same?
Here’s what I’ve learned: your KPI dashboard isn’t meant to judge you. It’s designed to guide you.
Progress isn’t linear. Some weeks will be messy. That’s not a problem—it’s part of being human.
The only thing that truly matters is that you keep showing up. That’s how real growth happens.
How to Analyze the Data from Your Personal Spreadsheet
Tracking data is only half the battle—the real transformation comes when you analyze that data and use it to make meaningful changes.
I set weekly performance benchmarks for myself. Think of it like a game—you’re trying to “win the week.”
To make it visual, I color-code my results: green if I hit the target, red if I didn’t. Simple, but effective.
And whenever I fall short, I take a few minutes to reflect and analyze why.
Here are a few insights and adjustments I’ve made based on my own data:
Everything is connected
I noticed that heavy iPhone use late at night consistently affected my sleep quality.
When I don’t sleep well, I struggle to complete my planned Pomodoro sessions the next day. And that drop in productivity usually impacts my overall happiness and motivation.
Sometimes I stay up late watching TV on weekends. That’s fine once in a while—but I now remind myself of the true cost: poor sleep, sluggish mornings, and a drop in momentum.
Travel disrupts routines—more than you think
I work in affiliate marketing, which gives me the freedom to work remotely and travel often.
At first, it felt like a dream. “It’s just a 5-day trip,” I told myself.
But the reality? Travel often meant flight delays, sleep disruption, skipped workouts, and low focus once I returned home. Even short trips carried a productivity price tag.
After consistently tracking my data, I realized I was far more stable and focused when I stayed in one place. That insight alone made me rethink how often I travel.
Even small obstacles matter
For the longest time, I struggled to meet my daily water intake goal.
So I sat down and asked myself—what’s actually making this difficult?
It turns out the problem was simple: my water source was on a different floor, and I kept putting off the effort to go refill.
Once I realized that, I bought a giant 64oz water bottle. Now I fill it up once in the morning and I’m good for the day.
Problem solved.
Do you see the pattern?
The data didn’t just track my habits—it revealed my blind spots.
Once I understood what was really getting in the way, I could design better systems to support the behaviors I wanted.
That’s the power of data-driven self-awareness. It cuts through excuses and emotions, and helps you make decisions based on facts—not just feelings.
Final Thoughts
For the past seven years, I’ve been working online through affiliate marketing. No boss. No deadlines. No one looking over my shoulder.
And as my financial situation improved, even the pressure from my parents or my partner gradually disappeared.
In theory, I could just take it easy for the rest of my life—sleep in, relax, travel, enjoy myself.
There’s no one forcing me to hustle anymore.
But deep down, there’s still a fire. A desire to see how far I can go. What I’m capable of. And the truth is, no one is going to push me—except me.
That’s why my personal KPI dashboard matters so much.
It keeps me grounded. It holds me accountable.
It’s not just about tracking numbers—it’s about honoring the commitment I’ve made to myself.
Because at the end of the day, no external pressure will ever be as powerful as internal drive.
